Dividend Data
Access real-time stock data, including dividends and financials, with 30+ years of history in Google Sheets and Excel instantly.
Visit
About Dividend Data
Dividend Data is a powerful tool designed specifically for dividend and fundamental investors, providing them with seamless access to over 30 years of stock market data for more than 80,000 tickers. This innovative solution integrates directly into Google Sheets and Microsoft Excel, allowing users to retrieve vital financial information without the need for API keys, coding, or tedious copying and pasting. With Dividend Data, investors can quickly access crucial metrics such as dividends, yields, payout ratios, growth rates, financial statements, earnings, ratios, and price history through simple custom formulas. Just type in a formula, and the data appears live, making it an essential resource for anyone looking to enhance their investment strategy. Built by a dividend investor for dividend investors, Dividend Data stands out with its user-friendly interface and comprehensive features, ensuring that users gain access to institutional-grade data at a fraction of the cost.
Features of Dividend Data
Free Tier with Monthly Credits
Dividend Data offers a generous free tier that includes 2,500 monthly credits, allowing users to explore the platform without any trial expiration. This makes it accessible for both casual and serious investors who want to analyze financial data without upfront costs.
Custom Functions for Dividend Investors
The tool boasts 16 custom functions that cater specifically to the needs of dividend investors. These functions cover a wide range of financial metrics, enabling users to gather detailed insights into stock performance and dividend distributions effortlessly.
Extensive Historical Data
With over 30 years of historical data available, Dividend Data allows investors to conduct comprehensive analyses and track trends over significant periods. This wealth of information empowers users to make informed investment decisions based on long-term performance insights.
Cross-Platform Compatibility
Dividend Data seamlessly integrates with both Google Sheets and Microsoft Excel, ensuring that users can access their investment data on the platform they prefer. This versatility enhances user experience and facilitates data analysis through familiar spreadsheet tools.
Use Cases of Dividend Data
Dividend Tracking and Analysis
Investors can utilize Dividend Data to track their dividend income and growth rates effectively. By employing custom formulas, users can assess the sustainability of dividends and make adjustments to their portfolios as necessary.
Financial Performance Evaluation
Using Dividend Data, fundamental investors can evaluate the financial health of various companies by accessing a range of ratios and metrics. This enables them to compare stocks and identify investment opportunities based on solid financial foundations.
Portfolio Management
With the portfolio tracking feature, users can automatically link their portfolios and view aggregate statistics. This allows investors to monitor overall performance and make informed decisions about rebalancing their investments.
Research and Insights
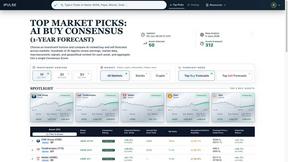
Dividend Data serves as an essential research tool, allowing investors to conduct in-depth analyses of stocks. By leveraging the AI-powered research assistant, users can gain valuable insights and enhance their investment strategies with up-to-date information.
Frequently Asked Questions
What types of data can I access with Dividend Data?
Dividend Data provides access to a wide range of financial metrics, including dividends, yields, payout ratios, growth rates, financial statements, earnings, and historical price data for over 80,000 tickers.
Do I need to know how to code to use Dividend Data?
No, Dividend Data is designed for ease of use. Users can access data simply by typing in custom formulas, eliminating the need for coding or complex setups.
Is there a free version of Dividend Data?
Yes, Dividend Data offers a free tier that includes 2,500 monthly credits, allowing users to explore the platform and utilize its features without any trial expiration.
Can I use Dividend Data on both Google Sheets and Excel?
Absolutely! Dividend Data is compatible with both Google Sheets and Microsoft Excel, making it versatile for users who prefer either platform for their financial analysis.
Similar to Dividend Data


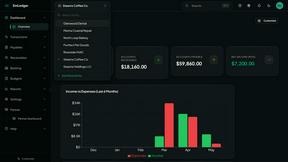
EmLedger
EmLedger offers unified multi-entity accounting with real double-entry features at one flat fee, eliminating costly per-entity charges.
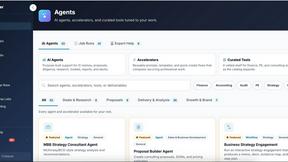
Decker
Decker is the essential platform that transforms consultant deliverables into actionable insights, empowering you to build, learn, and monetize.

Liners Africa
Your essential guide to Africas software ecosystem for discovering, comparing, and reviewing the tools your business needs.

FX Radar
FX Radar delivers real-time forex and financial news, empowering traders with instant insights and professional performance tracking tools.