CHILI GraFx vs Master Metrics
Side-by-side comparison to help you choose the right tool.
CHILI GraFx is the essential AI platform that automates on-brand visual content creation at scale.
Last updated: April 13, 2026
Master Metrics
Master Metrics unifies all your marketing data for automated, smarter decisions.
Last updated: February 28, 2026
Visual Comparison
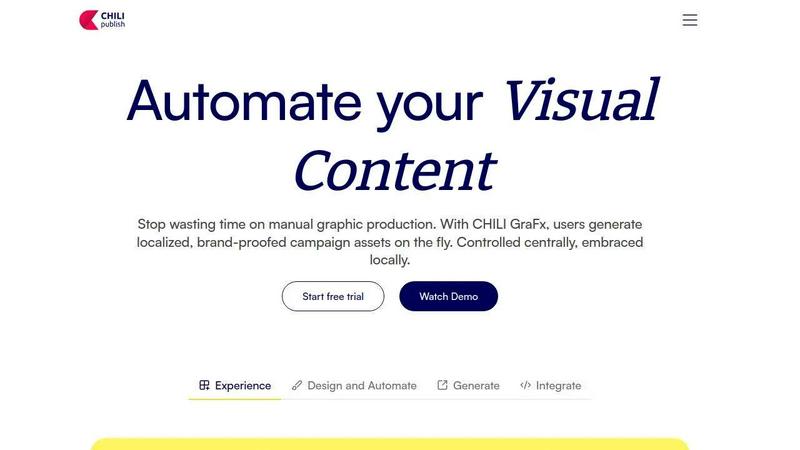
CHILI GraFx
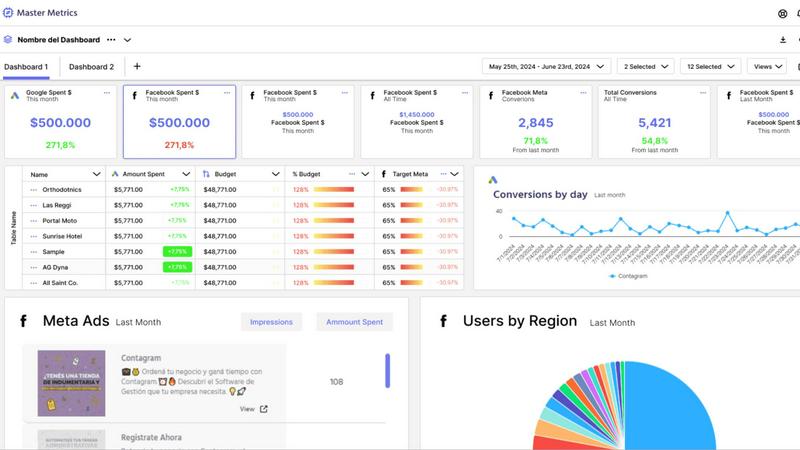
Master Metrics
Feature Comparison
CHILI GraFx
Smart Templates
Smart Templates are the foundational, must-have feature of CHILI GraFx. These are dynamic design templates with built-in business logic and rules that automate adaptation. They allow non-designers to generate thousands of on-brand variations by simply inputting data or selecting options, ensuring every output adheres strictly to predefined brand guidelines for fonts, colors, and logo placement without any manual oversight.
Centralized Brand Control
This feature is critical for maintaining absolute brand integrity at scale. Central administrators can lock down essential brand elements—such as approved logos, color palettes, fonts, and imagery—within the template framework. This guarantees that regardless of how many local users or markets generate assets, every single piece of content remains perfectly on-brand and professionally consistent.
Data-Driven Graphics Automation
CHILI GraFx seamlessly integrates with external data sources (like CRM, PIM, or spreadsheets) to automate personalized content creation. This is essential for producing highly targeted shopper marketing materials, direct mail, or digital ads. The platform automatically populates templates with product information, customer data, or local offers, turning large datasets into millions of unique, personalized graphics with zero manual design work.
Integrated Ecosystem & APIs
For enterprise scalability, CHILI GraFx offers robust integrations and APIs. It connects with essential systems like Digital Asset Management (DAM) platforms, e-commerce backends, and web-to-print workflows. This connectivity is vital for creating a seamless, end-to-end content production pipeline, eliminating silos and ensuring automated graphics flow directly to where they are needed for publishing or printing.
Master Metrics
Unified Overview Control Panel
The Overview Control Panel is your essential command center, providing an immediate, at-a-glance view of all account performance. Customize the overview table to surface the exact metrics that need your attention, pulling data from all connected sources. You can even add your own manual data and use formulas to merge information, creating a single source of truth that highlights opportunities and issues before they impact your budget or goals. This feature is critical for regaining control and ensuring no critical signal is lost in the noise.
Proactive Custom Alerts & Budget Control
Stop reacting to problems and start preventing them. Master Metrics' proactive alert system is a necessity for automatic business control. Set alerts for underperforming campaigns, dropping sales, or declining CRM rates. Crucially, control your daily ad spend to hit monthly budgets by getting notified when you are above or below a specific percentage. Receive these vital alerts directly in your email, Slack, WhatsApp, or other integrated tools, ensuring your team can act instantly without constant manual monitoring.
AI-Powered Client Presentation Generation
Eliminate the most time-consuming part of client reporting. With AI-generated Google Slides presentations, you can create professional, editable reports in just a few clicks. Simply choose your data sources, key metrics, goals, and a design template. Master Metrics' AI will automatically compile the data into a clear, visually compelling narrative. This feature is indispensable for agencies that need to deliver high-value insights quickly, turning data into persuasive stories without the manual grind.
Seamless Data Integration & Live Dashboards
Connect all your data sources once and let them refresh automatically. Master Metrics seamlessly integrates with platforms like Google Sheets and Looker, allowing you to extract and merge data from different sources into your favorite tools. Share insights effortlessly through public dashboard links, scheduled PDF email reports, or live views. Use custom metrics and formulas to answer any business question by blending data across platforms, making this an essential hub for actionable, always-current intelligence.
Use Cases
CHILI GraFx
Shopper Marketing & Local Store Adaptations
This is a primary use case where CHILI GraFx is indispensable. National brands can deploy centralized campaign templates that hundreds of local store managers or franchisees can easily adapt. Each local user can generate store-specific posters, flyers, or social media ads featuring local promotions, events, or inventory in minutes, all while staying fully within corporate brand guidelines.
Large-Scale Brand Execution & Rollouts
For global product launches or rebranding initiatives, CHILI GraFx is essential. Marketing teams can create a master set of Smart Templates for all required assets (packaging, advertising, in-store displays). Regional teams worldwide can then instantly generate all localized versions, ensuring a perfectly synchronized and consistent brand rollout across every market without delays or costly agency fees.
Automated Web-to-Print & Direct Mail
CHILI GraFx automates the entire web-to-print workflow, which is crucial for efficiency. Sales teams or partners can log into a portal, customize templated brochures or direct mail pieces with client-specific data, and place print-ready orders automatically. This enables the mass production of personalized print materials, like millions of uniquely coded direct mailers, with precision and no manual design bottleneck.
Agency Creative Production at Scale
For marketing and creative agencies, CHILI GraFx is a necessary tool to deliver more value to clients. It allows agencies to build sophisticated, brand-controlled template systems for their clients. This empowers the agency's talent to focus on high-concept creative strategy and design, while routine, high-volume asset production and client adaptations are handled efficiently through the automated platform.
Master Metrics
Agency Performance Monitoring & Client Reporting
For digital marketing agencies, Master Metrics is the essential backbone for managing multiple client accounts. The Overview Control Panel allows for instant cross-account health checks, while customizable dashboards and AI-generated Google Slides presentations streamline monthly and quarterly reporting. This eliminates dozens of manual work hours, ensures consistency, and provides clients with clear, data-driven narratives that justify ROI and build trust, making it a fundamental tool for scalable agency growth.
In-House Marketing Team Budget & Goal Management
In-house marketing teams must defend their budget and prove impact. Master Metrics provides the necessary tools to control daily and monthly ad spend proactively with automated alerts, preventing overspend and underspend. Teams can monitor campaign performance against goals in real-time, create custom dashboards for different stakeholders, and use merged data from ads, web analytics, and CRM to tell a complete performance story, securing their position as a data-driven, results-centric department.
E-commerce Sales & Advertising ROI Optimization
E-commerce businesses live and die by advertising efficiency and sales conversion. Master Metrics is critical for connecting ad spend data from platforms like Meta and Google with sales data from Shopify or other platforms. Teams can set alerts for sales drops or cost-per-acquisition spikes, use custom formulas to calculate true ROI, and bring product images into reports for context. This unified view is necessary to pivot strategies quickly and maximize profitable growth.
Automated Data Consolidation for Executive Reporting
Executives and managers need a high-level, consolidated view without the technical hassle. Master Metrics automates the entire data consolidation process from over 10+ sources into a single executive dashboard. Scheduled PDF reports can be sent automatically, and the Looker/Sheets connectors feed clean, merged data into existing BI workflows. This use case is vital for providing leadership with reliable, up-to-date insights for strategic decision-making, eliminating dependency on manual data compilation.
Overview
About CHILI GraFx
CHILI GraFx is an essential AI-powered platform for automated visual content production, built specifically for high-volume creative workflows. It is a non-negotiable solution for retail, shopper marketing, brand, and agency teams who must create, adapt, and scale branded assets faster without ever compromising on quality or brand consistency. The platform's core value proposition is delivering controlled creative freedom: centralizing brand governance while empowering local teams to generate on-brand, localized content independently. This eliminates the critical bottleneck of manual, repetitive design work, turning what used to take months and significant budget into a process that takes minutes. By connecting to data sources and existing systems, CHILI GraFx transforms static templates into dynamic "Smart Templates," enabling the automated generation of thousands of data-driven graphics for any channel or campaign. For any organization that must produce consistent, compelling visual content at scale across multiple regions, formats, and campaigns, CHILI GraFx is not just an option; it is a fundamental requirement for modern marketing efficiency and brand integrity.
About Master Metrics
Master Metrics is the non-negotiable, all-in-one command center for marketing analytics, built specifically to eliminate the chaos of scattered data. It is an essential tool for digital marketing agencies and in-house marketing teams who are tired of wasting countless hours manually wrangling data from disparate sources. The platform unifies analytics from over 10+ advertising platforms and data sources into a single, actionable view, transforming raw numbers into clear, decisive intelligence. Its core, must-have value proposition is to simplify complex marketing and sales analytics, enabling teams to monitor performance, control budgets, and maximize ROI effortlessly. With features designed by marketers who have lived the agency life, Master Metrics consolidates the entire reporting and monitoring workflow. From a vital Overview Control Panel to AI-generated client presentations, it provides the unified clarity necessary to make data-driven decisions instantly and report to clients with confidence, finally replacing manual spreadsheets and fragmented tools with one powerful, necessary platform.
Frequently Asked Questions
CHILI GraFx FAQ
Who is CHILI GraFx designed for?
CHILI GraFx is essential for any organization that must produce high volumes of branded visual content consistently and efficiently. Its primary users are retail and shopper marketing teams, global brand managers, in-house creative agencies, and marketing agencies serving clients with multi-location or data-driven marketing needs. It is built for both central marketing teams who govern the brand and local teams who need to execute it.
How does CHILI GraFx ensure brand consistency?
Brand consistency is guaranteed through a system of centrally controlled Smart Templates. Brand managers define and lock all critical elements—logos, fonts, color palettes, approved imagery, and layout rules—directly into the templates. When local users generate assets, they can only modify pre-approved fields (like text, local offers, or product images), making it impossible to create off-brand content. This control is non-negotiable for scalable production.
Can CHILI GraFx integrate with our existing systems?
Yes, integration capability is a core, must-have strength of CHILI GraFx. The platform offers APIs and pre-built connectors to fit into your existing tech stack. It commonly integrates with Digital Asset Management (DAM) systems like Bynder to pull in approved assets, Product Information Management (PIM) systems for dynamic product data, e-commerce platforms, and web-to-print solutions to create a seamless end-to-end workflow.
What is the difference between a regular template and a Smart Template?
A regular template is a static file (like a PSD or InDesign document) that requires a designer to manually edit every element for each variation. A Smart Template in CHILI GraFx is dynamic and intelligent. It contains built-in logic, rules, and connections to data. Users interact with a simple form or connect a data feed, and the platform automatically generates a perfect, on-brand asset by applying the rules—changing text, swapping images, and resizing layouts automatically without design skill.
Master Metrics FAQ
What makes Master Metrics different from other analytics dashboards?
Master Metrics is built specifically for the operational realities of marketing agencies and teams by founders who have lived that life. Unlike generic BI tools, every feature, from the Overview Control Panel to budget-specific alerts and AI client presentations, solves a direct, daily pain point. It prioritizes unification, automation, and actionable insight over just visualization, making it a necessary platform for managing performance and reporting, not just viewing data.
How many data sources and platforms can I connect?
Master Metrics currently unifies data from over 10+ major advertising platforms and data sources, with more being added regularly. The platform is designed to be your single command center, pulling in data from paid social, search ads, web analytics, and CRM tools to eliminate the need to jump between multiple interfaces and spreadsheets for a complete picture.
Can I create custom calculations with data from different sources?
Absolutely. This is a core, essential capability. Master Metrics allows you to create custom metrics and formulas using data merged from any of your connected sources. This means you can calculate true blended ROI, create custom performance scores, or build any other business-specific KPI that requires data from multiple platforms, answering complex questions that standard reports cannot.
How does the AI Presentation feature work?
The AI Presentation feature streamlines client reporting dramatically. You select the data sources, specific metrics, time frames, and goals you want to highlight, then choose a visual design template. Master Metrics' AI then automatically generates a fully editable Google Slides presentation populated with your data, charts, and insights. This reduces a task that often takes hours to a matter of minutes, ensuring consistency and professionalism.
Alternatives
CHILI GraFx Alternatives
CHILI GraFx is an AI-powered platform in the marketing technology category, specifically designed for scaling visual content production. It enables retail and shopper marketing teams to create, adapt, and manage high volumes of on-brand creative assets efficiently, ensuring consistency across all campaigns and channels. Users often explore alternatives for various practical reasons. These can include budget constraints, the need for different feature sets, or a requirement to integrate with other specific platforms in their existing tech stack. The search for a different solution is a normal part of finding the right fit for a team's unique workflow and scale. When evaluating other options, key considerations should include the platform's core ability to maintain brand consistency at scale, its automation and AI capabilities for speeding up production, and how well it integrates with your current marketing and asset management tools. The priority is finding a system that addresses your team's specific necessity for speed, control, and quality in visual content creation.
Master Metrics Alternatives
Master Metrics is the essential, all-in-one AI platform that unifies marketing data from over ten advertising sources into a single command center. It belongs to the marketing analytics and reporting category, designed to eliminate manual data chaos for agencies and in-house teams. Users may explore alternatives for various reasons, such as specific budget constraints, the need for different integration capabilities, or unique platform requirements that demand a tailored feature set. It's a critical decision, as the right tool must fit your operational workflow and scale with your business. When evaluating any alternative, prioritize solutions that offer true data unification, proactive alerting, and seamless integration with your existing stack. The non-negotiable core is a platform that transforms raw data into actionable intelligence without requiring manual effort, ensuring you maintain control over performance and budgets.