Fusedash vs StatPecker
Side-by-side comparison to help you choose the right tool.
Fusedash transforms raw data into insightful dashboards and charts, empowering teams to act on insights instantly.
Last updated: March 4, 2026

StatPecker
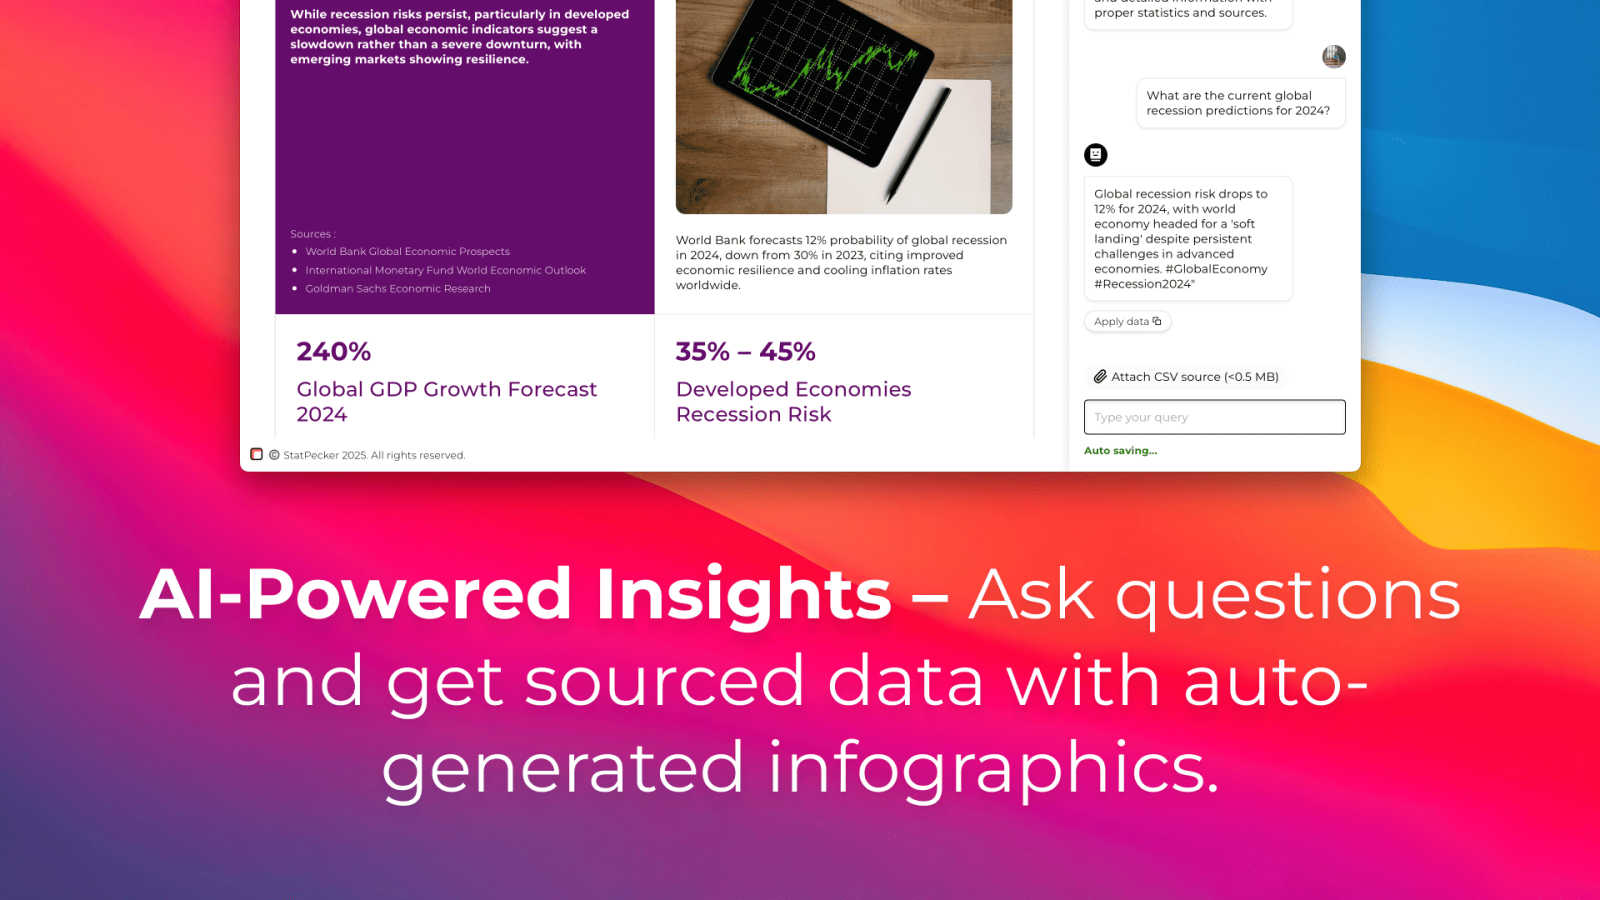
StatPecker gives leaders secure AI insights from company data without leaks.
Last updated: March 1, 2026
Visual Comparison
Fusedash

StatPecker
Feature Comparison
Fusedash
Flexible Views
Fusedash provides a versatile platform for creating tailored dashboards, charts, maps, and reports that cater to the unique needs of different teams. Users can customize layouts, filters, and time ranges to ensure stakeholders see the most relevant data without unnecessary back-and-forth communication.
AI Chart Generator
The AI Chart Generator in Fusedash enables users to swiftly create visually appealing charts from CSV files or APIs within minutes. It streamlines the process of selecting the right chart type, applying comparisons, and refining labels, making the data narrative clearer and more compelling.
Dashboard Software
Fusedash combines dashboards and reporting into a single workspace, allowing for a seamless integration of performance views with narrative context. This feature enhances clarity by explaining what changed, why it matters, and what actions should be taken next, reducing discrepancies in reporting.
AI Chat
The Smart Chat feature allows users to interact with their data effortlessly. By asking questions in plain language, users can explore breakdowns, receive suggestions for charts or metrics, and quickly turn insights into shareable dashboard views, making data exploration intuitive and efficient.
StatPecker
Local SQL Agent for Private CSV Analysis
This is a critical feature for data security and immediate insight. You can upload a CSV file up to 50 MB, and StatPecker's local engine processes everything directly on your device. This guarantees your sensitive business data remains completely private. You can then explore your data with simple questions and receive answers as clean, ready-to-share charts and visuals, eliminating the hassle and risk of using external spreadsheets or cloud services for preliminary analysis.
AI-Powered Query for Instant Insights
Stop wrestling with complex data tools. StatPecker's core functionality allows you to get instant insights by simply asking questions in plain language. The AI queries validated sources and generates clear, credible answers, transforming your curiosity into professional visuals without any need for coding, complex formulas, or data science expertise. This feature is essential for rapid analysis and decision-making.
Publish & Embed Interactive Visuals
Your data stories need to live where your audience is. StatPecker enables you to seamlessly publish your generated infographics and make them interactive. You can embed these visuals directly into blogs, articles, websites, or internal wikis, providing dynamic and engaging content that enhances your narrative and keeps readers engaged with the data, a must-have for content creators and modern reporting.
Download & Use Anywhere
Flexibility is non-negotiable. Once your visual is created, you are not locked into the platform. StatPecker allows you to export your infographics as high-quality images for immediate use in reports, presentations, social media, or print materials. This ensures your compelling data visuals can be integrated into any workflow or medium, maximizing the utility and reach of your analysis.
Use Cases
Fusedash
Team Performance Monitoring
Fusedash allows teams to monitor their key performance indicators in real-time, enabling them to stay on top of their goals. By visualizing performance data, teams can quickly identify trends and take proactive measures to enhance productivity.
Marketing Campaign Analysis
Marketing teams can utilize Fusedash to analyze the effectiveness of their campaigns through interactive dashboards. By visualizing data from various sources, they can make informed decisions based on real-time insights, optimizing campaign performance strategically.
Financial Reporting
Finance teams can streamline their reporting processes using Fusedash, which allows them to combine multiple data sources into a single view. This consolidates financial data and enhances the accuracy of reports, ensuring that stakeholders have access to the same reliable information.
Customer Insights Exploration
With Fusedash, organizations can delve into customer data to uncover insights about behavior and preferences. By creating detailed maps and charts, teams can tailor their strategies to meet customer needs more effectively, driving engagement and satisfaction.
StatPecker
Content Creators & Bloggers
For creators, compelling visuals are essential for engagement and authority. StatPecker is a necessity for transforming research data, surveys, or industry statistics into stunning, embeddable infographics that elevate blog posts and articles. It allows them to quickly create credible, shareable content that explains complex topics simply, saving hours of design work and making their content more persuasive and professional.
Business Analysts & Data Teams
Analysts under constant pressure to deliver reports need to communicate findings effectively. StatPecker is critical for rapidly converting CSV exports and SQL query results into clear charts and visuals for stakeholder presentations. It automates the tedious visualization step, allowing analysts to focus on insight generation and ensuring their messages are understood and acted upon quickly.
Marketing Professionals
Marketers must prove campaign ROI and present market research persuasively. StatPecker is indispensable for creating impactful charts and infographics from performance data (like sales figures or engagement metrics) for reports, client decks, and social media content. It turns dry numbers into compelling visual stories that demonstrate value and drive strategic decisions.
Educators & Trainers
Explaining data-driven concepts requires clarity. Educators and trainers can use StatPecker as an essential tool to create easy-to-understand visual aids and infographics from educational data or historical trends. This enhances learning materials, presentations, and coursework, helping students grasp complex information through clear, professional visuals without needing design skills.
Overview
About Fusedash
Fusedash is a cutting-edge AI-powered data visualization platform that revolutionizes how teams interact with their connected data. Designed for organizations seeking clarity and actionable insights, Fusedash serves as a unified workspace where users can create comprehensive dashboards, interactive charts, detailed maps, and narrative reports without the hassle of managing multiple disconnected tools. The core value proposition of Fusedash lies in its ability to ensure consistency and efficiency; users can define key metrics and KPIs once and apply these standardized definitions across all reports and views. This approach guarantees that every team member, from leadership to marketing and operations, relies on the same trusted data. Ideal for teams weary of manual reporting cycles and conflicting narratives, Fusedash empowers users to monitor real-time data while also delving deeper into the reasons behind trends by segmenting information by various dimensions such as regions or time periods. With integrated AI features, like natural language data chat and smart visualization assistance, Fusedash accelerates the data exploration and reporting process, transforming raw data into a shared source of truth that fosters alignment and drives informed action.
About StatPecker
StatPecker is an essential, non-negotiable tool for anyone who needs to communicate data with clarity and impact. It solves the critical, time-draining problem of manual data reporting and the prohibitive cost of hiring professional designers by automating the entire data storytelling process. This AI-powered platform transforms raw, complex data into professional, publication-ready visuals and infographics in seconds. It is an absolute necessity for creators, analysts, marketers, and educators who must turn spreadsheets and numbers into engaging, persuasive, and easy-to-understand narratives without any technical expertise. The core value proposition is undeniable: save significant time, cut costs dramatically, and boost the impact of your communications by making data visually compelling and instantly shareable. From analyzing uploaded CSV files with its private, on-device Local SQL Agent to generating insights through simple AI queries, StatPecker delivers credible answers as stunning visuals you can embed, download, and use anywhere, making it the indispensable solution for modern data-driven communication.
Frequently Asked Questions
Fusedash FAQ
What types of data can I integrate with Fusedash?
Fusedash supports a variety of data integrations, including CSV uploads, API connections, and public data sources. This flexibility allows users to bring all relevant data into a single platform for comprehensive analysis.
Can I customize dashboards for different audiences?
Yes, Fusedash allows you to create customized views of your data tailored to different audiences. You can adjust layouts, filters, and time ranges to ensure that each stakeholder receives the information most relevant to them.
How does the AI Chart Generator work?
The AI Chart Generator quickly transforms raw data from CSVs or APIs into professional-looking charts. It intelligently suggests the best chart types and comparisons, ensuring your visuals accurately convey the intended message.
Is Fusedash suitable for non-technical users?
Absolutely. Fusedash is designed with user-friendliness in mind, featuring intuitive interfaces and natural language processing capabilities that make it accessible for users with varying levels of technical expertise.
StatPecker FAQ
How does the Local SQL Agent ensure my data is private?
Privacy is the foundational principle of the Local SQL Agent. When you upload a CSV file, the entire processing and analysis engine runs locally on your own device. Your data is never sent to or stored on StatPecker's servers. The system prepares the data, generates SQL queries, and creates the visuals entirely on your machine, ensuring complete confidentiality for sensitive business or personal information.
What kind of questions can I ask the AI to get insights?
You can ask a wide range of practical, business-oriented questions in plain English. For example, you can ask for trends over time ("Show sales growth last quarter"), comparisons ("Which product category has the highest revenue?"), summarizations ("What is the average customer spend?"), or rankings ("List the top 5 regions by performance"). The AI interprets your intent and generates the appropriate query to return a clear visual answer.
Can I edit the visuals after StatPecker generates them?
Yes, maintaining control over your final output is essential. StatPecker provides options for manual edits on your generated visuals, especially for embeds. This allows you to adjust colors, and labels, or tweak the design to ensure the visual perfectly aligns with your brand guidelines or presentation style before publishing or sharing it widely.
What are the limits of the Free Tier?
The Free Tier is designed for essential, regular use. It includes unlimited projects and embeds, 25 AI queries, and 10 CSV uploads. This is sufficient for individuals or small teams to start creating impactful data stories immediately. For high-volume needs with unlimited AI queries and CSV uploads, the Lifetime Access plan provides a complete, one-time solution.
Alternatives
Fusedash Alternatives
Fusedash is an AI-powered data visualization platform that falls under the categories of Analytics & Data and Business Intelligence. It is designed to transform raw data into clear, actionable insights through decision-ready dashboards and interactive charts. Organizations frequently seek alternatives to Fusedash for various reasons, including pricing concerns, specific feature requirements, or platform compatibility needs. As businesses evolve, their data visualization demands may change, prompting the search for solutions that better align with their objectives. When considering alternatives, it's essential to evaluate factors such as ease of use, integration capabilities, support for real-time data, and the ability to generate consistent, reliable reports. Users should prioritize platforms that facilitate collaboration across teams and offer intuitive interfaces for navigating complex data sets. A well-chosen alternative can enhance data-driven decision-making and optimize organizational efficiency.
StatPecker Alternatives
StatPecker is an essential AI-powered analytics and data visualization tool. It is a necessity for leaders and creators who must transform raw data into professional, impactful visuals and insights without delay or security risks. Users often seek alternatives to find a solution that aligns perfectly with their specific budget, required feature set, or integration needs with other platforms. When evaluating other options, the critical factors to prioritize are core capabilities. You must have robust AI-driven analysis, seamless data import functionality, and secure, embeddable output. The right tool will eliminate manual reporting, cut costs dramatically, and make your data communications instantly more persuasive and shareable.