MyLens

About MyLens
MyLens is a powerful AI tool designed for professionals and students seeking to simplify and visualize complex information. Users can upload various documents to create engaging visual summaries, such as mind maps and tables, enhancing comprehension and enabling quicker decision-making.
MyLens offers flexible pricing plans, allowing users to choose from basic to premium tiers. Each subscription provides unique features, such as advanced visualization tools and priority support. Upgrading unleashes the full potential of MyLens, ensuring users gain maximum value and efficiency in their tasks.
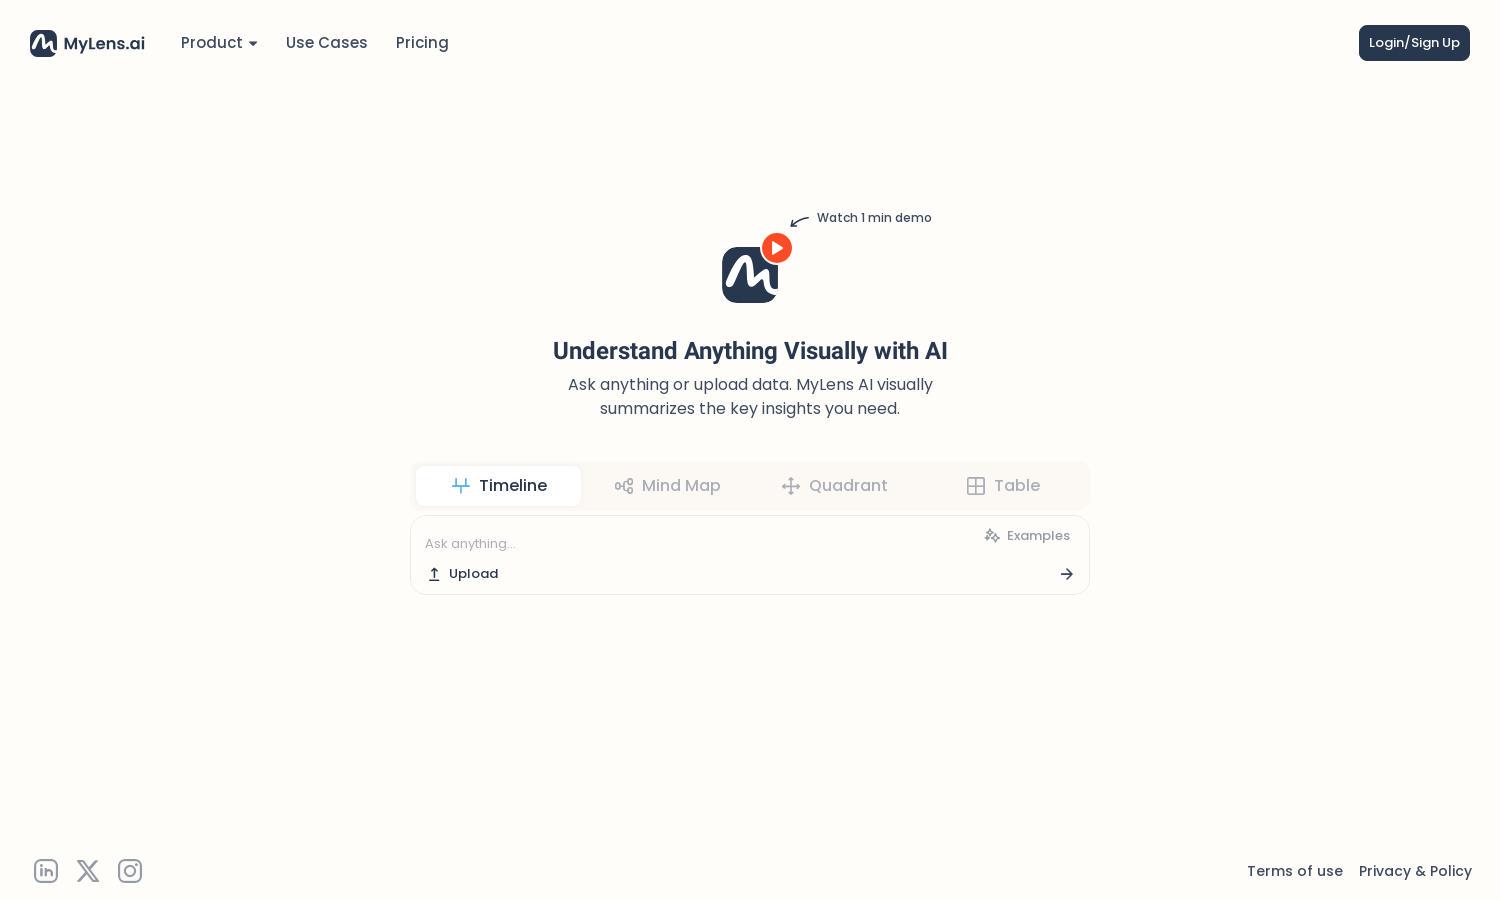
The user interface of MyLens is designed for seamless navigation and efficient interaction. With an intuitive layout and user-friendly features, users can easily upload documents and create visuals in minutes. MyLens enhances the overall user experience, making complex data understandable.
How MyLens works
To start using MyLens, users simply sign up and upload their documents, such as PDFs or articles. The AI quickly analyzes the content and transforms it into engaging visuals, like mind maps or timelines. Users can then customize and share their visual summaries, making complex information accessible and easier to comprehend.
Key Features for MyLens
AI-Powered Visual Summarization
MyLens' AI-powered visual summarization feature transforms complex data into visually engaging formats instantly. By leveraging advanced algorithms, this unique capability helps users comprehend and retain essential information quickly, ensuring that MyLens stands out as a premier tool for visualization and data summarization.
Multi-Format Support
MyLens excels with its multi-format support, enabling users to upload PDFs, articles, and datasets seamlessly. This flexibility enhances user experience, as it allows a diverse range of content to be visualized and summarized effectively, making MyLens a versatile tool for various data types.
Beautiful Visual Outputs
One of MyLens' standout features is its ability to generate beautiful visual outputs like mind maps, tables, and timelines. This functionality not only aids in simplifying complex information but also enhances user engagement and presentation quality, making learning and sharing information enjoyable.
You may also like:


